
AI-assisted data preparation and multimodal alignment
An advanced import workflow helps users prepare complex 3D datasets with guided preprocessing tools, including brightness correction, AI-assisted stack alignment, and AI-based denoising optimized for SEM data. For multimodal workflows, Tescan 3D Viewer™ also supports dataset alignment for correlating data acquired using different imaging and analytical techniques, helping users combine structural and analytical information within one coherent 3D environment.
Tescan 3D Viewer™
Intuitive 3D visualization for complex volumetric and multimodal data
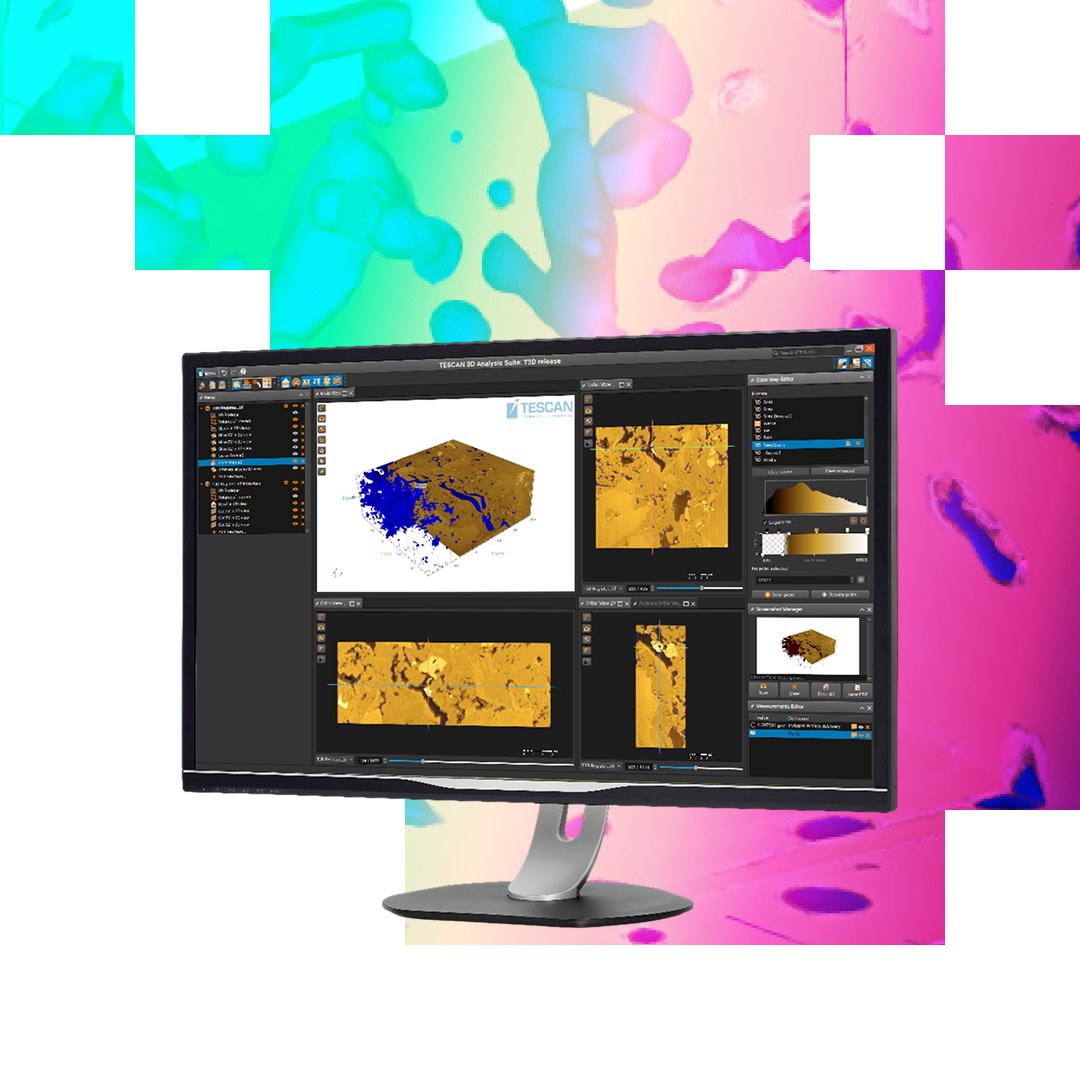
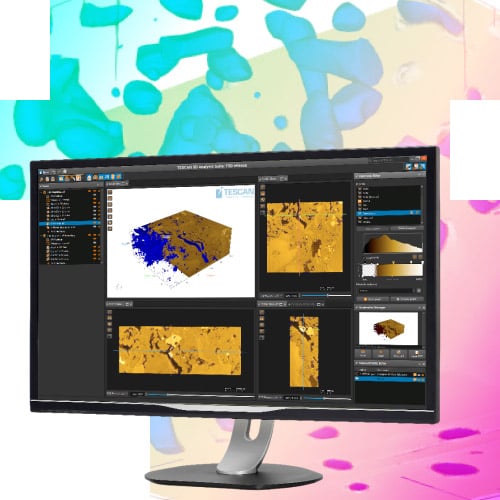
Tescan 3D Viewer™ extends the Tescan workflow beyond acquisition, giving users an advanced yet intuitive environment for importing, preparing, correlating, and visualizing complex 3D datasets.
Working with volumetric and multimodal data often requires multiple tools, manual preparation, and specialized expertise before results can be reliably interpreted or shared. Tescan 3D Viewer™ reduces this complexity by combining guided import, AI-assisted preprocessing, multimodal alignment, high-performance visualization, and presentation tools in one connected software environment.
Optimized for 3D SEM, FIB-SEM, VolumeEM, and multimodal datasets, the software supports a wide range of volumetric data types from different imaging and analytical workflows. Import workflows help users bring data into the application efficiently and prepare it for visualization, correlation, and further analysis.
Advanced preprocessing tools include brightness correction, AI-assisted denoising, and stack alignment. Tescan 3D Viewer™ also supports alignment and correlation of datasets acquired using different imaging and analytical techniques, helping users combine structural and analytical information within one coherent 3D representation.
Dedicated import workflows support spectral EDX data, including selected Oxford Instruments formats, and TOF-SIMS data from Tofwerk detectors. For VolumeEM workflows, a specialized import wizard supports tiled datasets, panorama stitching, and detection of damaged slices.
Built for large-scale datasets, Tescan 3D Viewer™ uses a high-performance 3D visualization engine capable of rendering multiple volumetric datasets alongside polygonal models. This enables users to explore complex structures, compare correlated data, and communicate spatial relationships within one interactive scene.
A fully integrated timeline-based video editor enables users to create professional 3D animations and scientific visualizations for reporting, collaboration, and presentation.
Together, these capabilities make Tescan 3D Viewer™ a connected environment for advanced 3D data preparation, visualization, and communication. The workflow can continue into Tescan Picannto™ for segmentation and annotation, or be extended through Compox™, the Python-based extensibility layer for custom data processing algorithms.
Typical applications
-
3D tomography data processing and visualization
- High-performance 3D rendering Advanced analysis of 3D SEM, FIB-SEM, and VolumeEM data
- Multimodal Analysis
Fusion of spectral (EDX, TOF-SIMS) and imaging data into unified 3D models
- Professional 3D visualization for reporting
Creation of professional 3D animations for scientific communication and reporting
- Support for VolumeEM
Tailored import wizard with damaged slice detection and replacement
.png?width=201&height=200&name=_%20Application%20area%20icon%20(3).png)
Tescan Spectral CT in Electronics and Semiconductors
Non-destructive spectral imaging for material verification and internal inspection of advanced electronic assemblies.
TrueContrast™ multi-energy imaging for differentiating polymers, metals, and encapsulants
-
K-edge detection for accurate identification of high-Z elements
-
Non-destructive visualization of interfaces and buried defects in electronic packages
-
Spectrum comparison tools for verifying material uniformity and contamination sources
Tescan Spectral CT delivers compositional insight where conventional micro-CT cannot. Engineers can distinguish packaging materials, solder alloys, and internal structures without sectioning or coating—supporting reliable failure analysis, design validation, and quality assurance across next-generation electronic devices.
Tescan Spectral CT in Materials Science
Multi-energy micro-CT for elemental and structural differentiation in complex, multi-phase materials.
-
Elemental mapping for identifying fillers, dopants, or additives in polymer composites
-
Spectral contrast for distinguishing polymers, ceramics, and metals with similar densities
-
Non-destructive 3D analysis of internal interfaces and phase boundaries
-
Integrated Spectral Suite for correlating elemental and structural data in one workflow
In materials research, Spectral CT enables scientists to explore the relationship between structure and composition without destroying samples. Researchers can visualize distribution of additives, analyze composite uniformity, and study degradation pathways—supporting more reliable material design and performance assessment.

Tescan Spectral CT in Geoscience and Mining
Full-spectrum micro-CT for 3D elemental and structural insight into geological samples.
-
Non-destructive 3D elemental mapping of rocks, ores, and mineral inclusions
-
K-edge detection for locating and identifying high-value or trace elements like gold or rare earth elements
-
Enhanced contrast for complex mineral assemblages and pore networks
-
Large-volume spectral scanning for full-core or fragment-scale analysis
For geoscientists and mining professionals, Spectral CT provides simultaneous elemental and structural data from intact samples. It supports mineral identification, ore classification, and recovery assessment—reducing dependency on destructive assays while preserving geological material for further study.
INTEGRATION THAT DRIVES INSIGHT
Tescan Spectral CT works seamlessly with SPECTRAL Suite and Acquila™ micro-CT control software to streamline spectral imaging from acquisition to analysis. Used as an add-on with the UniTOM XL platform, users can target volumes of interest, capture full-spectrum data, and visualize structural and elemental information in one workflow.
Researchers benefit from intuitive controls, guided reconstruction, and automated spectral processing. Spectral Suite handles spectrum matching, K-edge detection, and compositional mapping with minimal setup. This delivers consistent, reproducible results across samples and accelerates multi-energy micro-CT analysis.
.png?hsLang=en)
The trial version is available for 30 days and includes the full functionality of the application without any feature limitations.
Online registration is required to activate the trial. The computer must remain connected to the internet while the application is in use.
Each user account can activate one trial version. The same limitation applies to each individual computer.
Follow the trial activation instructions:

Contact us