
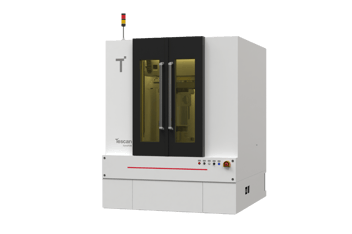
4D micro-CT is an extension of 3D X-ray computed tomography that adds time as the fourth dimension. By capturing a sequence of 3D scans during an experiment, researchers can observe how internal structures change over time without damaging the sample.
Listen to article
Understanding Microstructural Changes During Freeze-Drying
Dr. Sebastian Gruber, alongside a team of international researchers, contributed to a study titled "Pore Shape Matters – In-situ Investigation of Freeze-Drying Kinetics by 4D XCT Methods." This research, published in Food Research International, was a collaborative effort between the Technical University of Munich (TUM), Otto-von-Guericke University of Magdeburg, and Tescan XRE in Gent, Belgium. The study is a significant contribution to the food and pharmaceutical preservation industry, particularly concerning the optimization of freeze-drying processes, a critical method for extending the shelf-life of food products without compromising their structural integrity, bioactivity, or nutritional value.
The Role of Freeze-Drying in Food and API Preservation
Freeze-drying (also known as lyophilization) is a well-established preservation technique used to remove moisture from food and pharmaceutical products (APIs) by sublimating ice directly into vapor. This method retains the structure, flavor, color, activity, and essential nutrients of the products, making it an ideal preservation strategy. However, freeze-drying is energy-intensive, costly, and time-consuming. This study focused on understanding how the internal microstructure of products being freezing influences the efficiency of the process, with the goal of reducing the time and energy required.
Objectives of the Study
The central aim of the research was to explore how 3-dimensional structural parameters-pore size, shape, and orientation-affect the primary drying stage of freeze-drying. The drying process occurs through sublimation, and the researchers hypothesized that understanding and manipulating the product's microstructure could significantly optimize this process. The researchers utilized advanced 4D X-ray computed tomography (XCT) technology to observe freeze-drying kinetics in-situ, allowing them to analyze the relationship between the product's internal microstructure and the formation of the sublimation front.
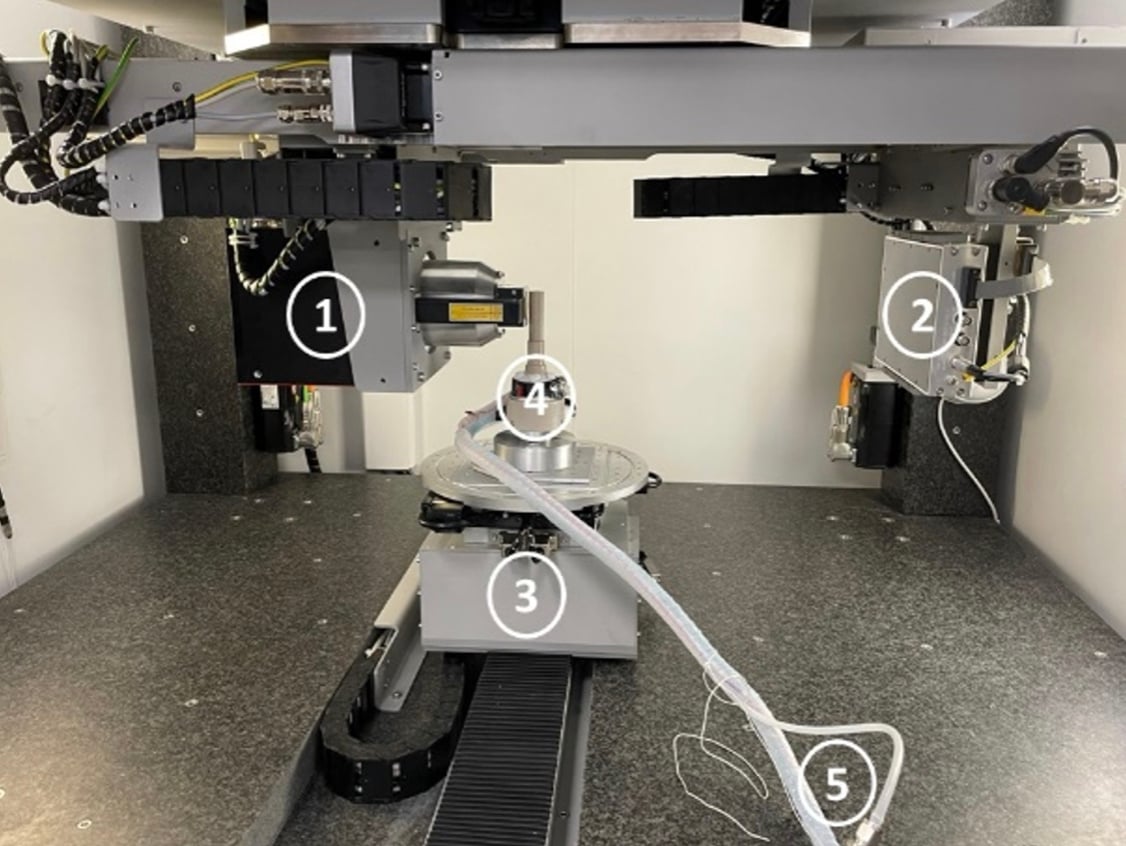 Figure 1: DynaTOM (Tescan micro-CT, Belgium) 1:X-Ray Source; 2: Detector; 3: Manipulator; 4: Freeze-Drying Stage; 5:Cables and pipe connected with outer equipment
Experimental Design: Materials and Methodology
The research team chose maltodextrin as a model substance due to its amorphous state and frequent use in food processing. Solutions of varying solid weight fractions (0.05, 0.15, and 0.3) were prepared and subjected to freeze-drying at different shelf temperatures (-11°C, -15°C, and -33°C). The innovative aspect of this study was the use of a 4D XCT system, specifically the Tescan DynaTOM system, which provided in-situ, real-time data on the drying process inside the samples.
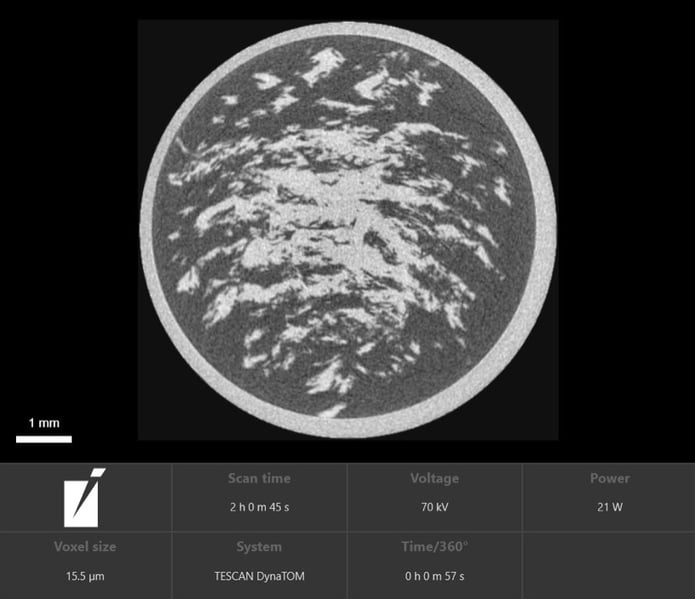 Figure 2: XY-slice of in-situ freeze-drying scan of maltodextrin with solid concentration 0.15 and drying temperature -11°C.
The samples were prepared and loaded into a custom freeze-drying stage that allowed for temperature control and pressure reduction to 10 Pa (link to the study here). Throughout the process, XCT scans captured changes in the structure of the samples, focusing on how pore size, shape, and orientation evolved and influenced the drying kinetics. Using this technique, the team was able to monitor the sublimation in front of the boundary between frozen and dried material without disrupting the samples.
 Figure 3: Flip point image generated using Panthera software of a conventional microstructure sample. The color gradient is an indication of change of the local linear attenuation coefficient as a function of time, blue being earlier in the experiment and red later. The YZ-slice shows the evolution of the sublimation front in a single image
Collaborative Input
Mr. Coppens, representing Tescan XRE, contributed critical expertise in the 4D XCT imaging technology, enabling the researchers to achieve high-resolution scans with temporal accuracy. His collaboration with researchers from TUM's Food Process Engineering and the Chair of Thermal Process Engineering at Otto-von-Guericke University of Magdeburg was essential in developing the experimental design and analyzing the data.
 Figure 4: Screenshot of Panthera software showing a maltodextrin structure freeze-dried at -30°C after annealing.
Key Observations from Dynamic CT Imaging
Pore Size and Drying Kinetics
The results demonstrated that pore size plays a vital role in determining the rate of sublimation. Larger pores enable a more rapid water vapor transport, resulting in faster drying times. For instance, samples with lower solid concentrations, such as 0.05 w/w, displayed larger pore sizes (approximately 65 µm) and dried more quickly than those with higher concentrations. The pore sizes varied significantly based on the solid concentration and freezing temperature, highlighting how careful control of these parameters can optimize drying rates.
Pore Orientation and Shape
Beyond pore size, the shape and orientation of pores were shown to have a profound impact on drying kinetics. The study revealed that longitudinal pores, especially those oriented perpendicular to the drying shelf, facilitated sublimation. These pores create a more direct pathway for water vapor to escape, reducing resistance. In contrast, more spherical or ellipsoidal pores, particularly those aligned parallel to the drying surface, increased the resistance to water vapor transport, slowing down the drying process.
Effect of Freezing Conditions
The research also highlighted the influence of freezing conditions on microstructure. Directional freezing, which introduces a temperature gradient between the cooling shelf and the top of the sample, led to the formation of more longitudinal pores. This technique could be harnessed to engineer specific pore structures that optimize the drying process. The lower the temperature during freezing, the more pronounced the differences in pore shape and orientation, with -33°C yielding smaller, more irregularly shaped pores compared to -11°C.
Mass Transport Resistance and Tortuosity
The tortuosity factor, a measure of the complexity of pore pathways, was also analyzed. Pores with a lower tortuosity factor (close to 1) indicated more linear, efficient pathways for water vapor transport, which correlated with faster drying kinetics. In contrast, more complex pore networks with higher tortuosity increased the resistance to mass transport. The study found that tortuosity alone does not fully explain the drying behavior; a combined analysis of pore size, shape, and orientation is necessary for a comprehensive understanding.
Changes in Microstructure during drying
Freeze-drying is typically described with no changes in microstructure, when no critical temperatures are exceeded. However, this study demonstrates the impact of shelf temperature on the microstructure. By using higher shelf temperatures, the microstructure not only changes in pore size, but also the shape and orientation of the pores are changing.
Figure 5: XZ-slices of in-situ freeze-drying scan of maltodextrin with drying temperature -30°C. Voxel resolution was 3.9 µm, time per rotation 10 min 39 sec and total experiment time 8 hours.
Applications of 4D Micro-CT in Freeze-Drying
The findings of this study have direct applications in optimizing freeze-drying protocols in the food and pharmaceutical industries. By controlling the freezing step to create favorable pore structures such as large, longitudinal pores aligned perpendicularly to the drying surface, manufacturers can significantly reduce drying times and energy costs. This has the potential to enhance the efficiency of freeze-drying processes at an industrial scale, reducing the overall environmental impact while maintaining product quality.
The collaboration between Technical University of Munich (TUM), Otto-von-Guericke University, and Tescan XRE demonstrates the power of interdisciplinary research in addressing complex challenges in food processing. The 4D XCT method offers a non-invasive, real-time solution for studying the internal dynamics of freeze-drying, which can be applied to a wide range of materials and products.
Conclusion
The research done by Dr. Gruber, Mr. Coppens and the team of collaborators represents a significant step forward in understanding the relationship between microstructure and freeze-drying kinetics. The use of advanced 4D XCT imaging has provided new insights into how pore characteristics influence the drying process, opening the door to more efficient and sustainable methods for food and pharmaceutical preservation. Future research could focus on refining the control of freezing parameters to engineer specific pore structures, further optimizing the freeze-drying process.
To learn more about the study, you can access the original article published in Food Research International here: Pore shape matters – In-situ investigation of freeze-drying kinetics by 4D XCT methods


Explore Dynamic Micro-CT
UniTOM® XL
Time-resolved micro-CT for dynamic process imaging.

DynaTOM®
High-speed CT for observing structural evolution over time.

Food Process Engineering
See how researchers use micro-CT to study food structures and dynamic processes.

Discuss Your Sample Preparation Workflow with Our Team