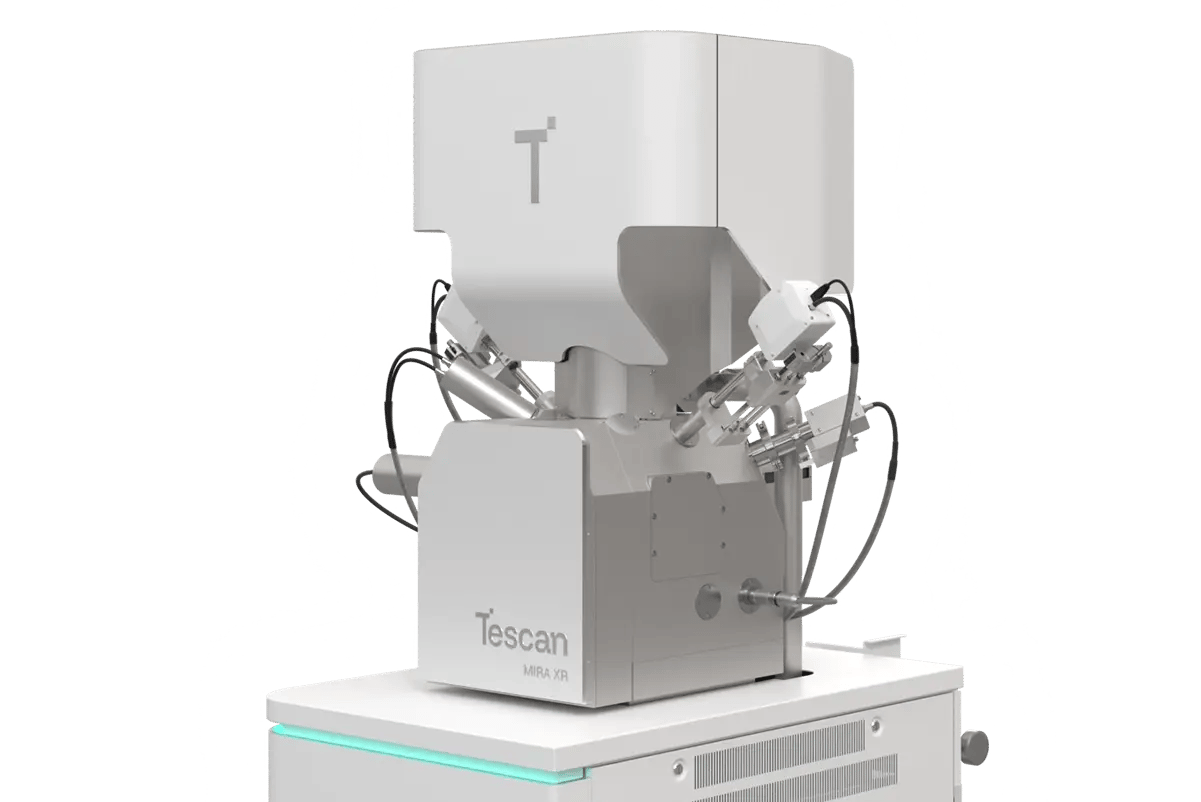
WEBINAR | Up to 40% Faster Automated TEM Lamella Preparation with new Ga⁺ FIB Column

Simplify SEM-EDS Petrological Analysis of Complex Rock Samples with Tescan

Use Tescan SEMs with Dual Essence™ EDS to perform integrated SEM-EDS analysis that resolves zonation and overlapping phases in complex geological samples.

hero
hero
Unlocked content

Expanding Imaging by Additional Layer of Information

Petrological samples often contain mineral phases with near-identical average atomic numbers, making them hardly indistinguishable in conventional BSE imaging. Subtle compositional zonation can remain completely hidden.

Tescan SEMs with integrated EDS (Essence™ EDS) enables high-resolution SEM imaging with fully integrated elemental mapping. Detect subtle elemental changes, identify mineral phases, and perform full SEM-EDS petrological analysis directly within the SEM interface.

Why Perform SEM-EDS Petrological Analysis

with Tescan MIRA XR and Dual Essence™?

01
Root of the Problem

Why BSE Imaging Alone Falls Short in Petrological Surface Analysis

Backscattered electron (BSE) imaging in SEM is essential in petrology for identifying minerals based on atomic number contrast. However, BSE can’t always distinguish between phases with similar average atomic numbers — for example, quartz and albite. In such cases, petrologically important details like mineral zonation remain hidden.

Tescan Essence™ EDS addresses this limitation by adding live elemental analysis directly into the SEM workflow. Without switching interfaces, users can immediately access compositional information, making it easier to differentiate minerals with similar BSE intensity and expose internal structures.

02
Materials and Methods

How SEM-EDS Petrological Analysis Was Performed

A garnet-bearing metamorphic thin section was imaged with SEM using BSE contrast and then analyzed using Essence™ EDS, directly within the Tescan Essence™ GUI. Elemental mapping and line profiles were performed to reveal compositional zonation in the garnet grain. The distribution of manganese, for example, highlighted growth features that were invisible in BSE mode.

Essence™ EDS also supported the use of classification diagrams for interpreting chemical variation, and Wide Field Mode™ enabled fast navigation and accurate placement of analytical points.

03
Results and Discussion

Elemental Mapping Reveals What BSE Misses

While BSE imaging provided morphological context, it failed to show compositional variation within the garnet. In contrast, Essence™ EDS immediately revealed internal zonation through elemental maps. Line scans and point measurements provided detailed compositional profiles, and the data was visualized using garnet classification diagrams.

This fully integrated approach — imaging and analysis in one interface — made the process faster, more efficient, and accessible to users of all experience levels.

GET IN Touch

Contact us

Get the most out of Tescan

This is more than information; it's an advantage. We've compiled our technical whitepapers, detailed product flyers, and on-demand webinars to provide you with the knowledge that makes a real difference. Sign up now to access the insights you need to make an impact.

Tescan Instruments & Technology

Used in This Workflow

Tescan MIRA™ XR with Dual Essence™ EDS

Tescan MIRA XR with Dual Essence™ EDS combines high-resolution SEM with real-time chemical analysis in a single, seamless interface.

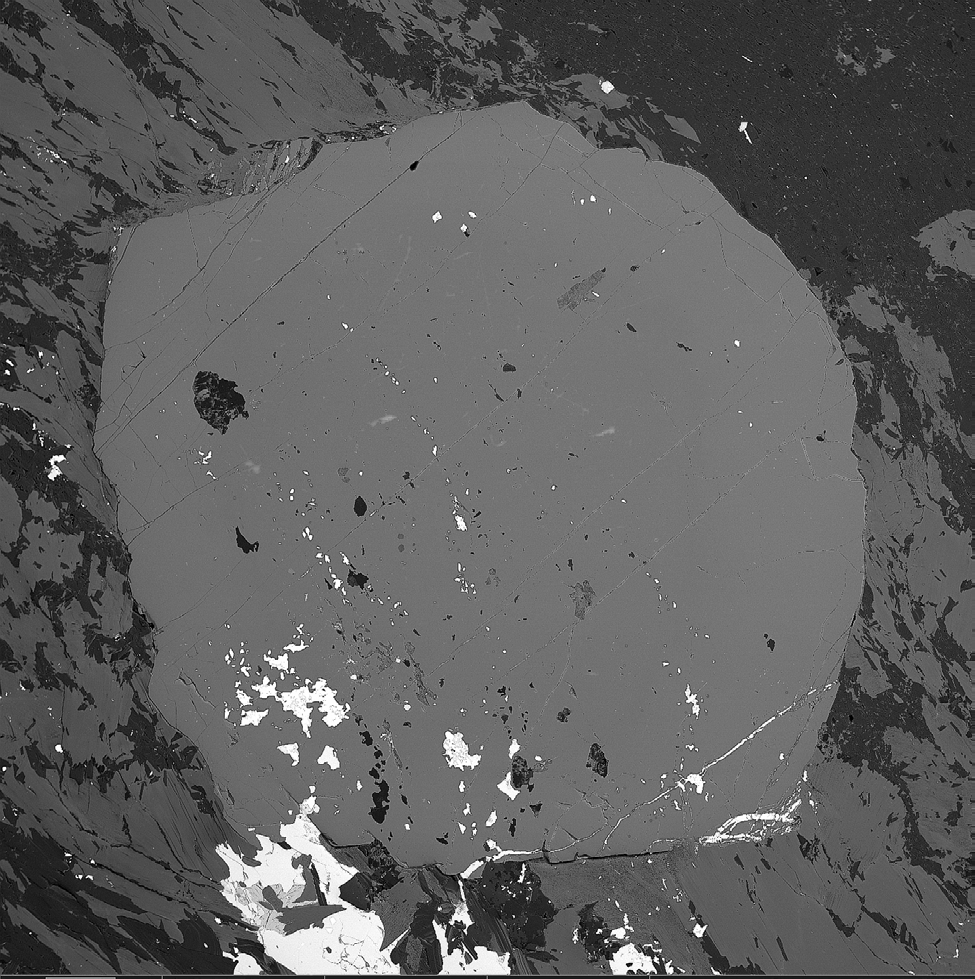
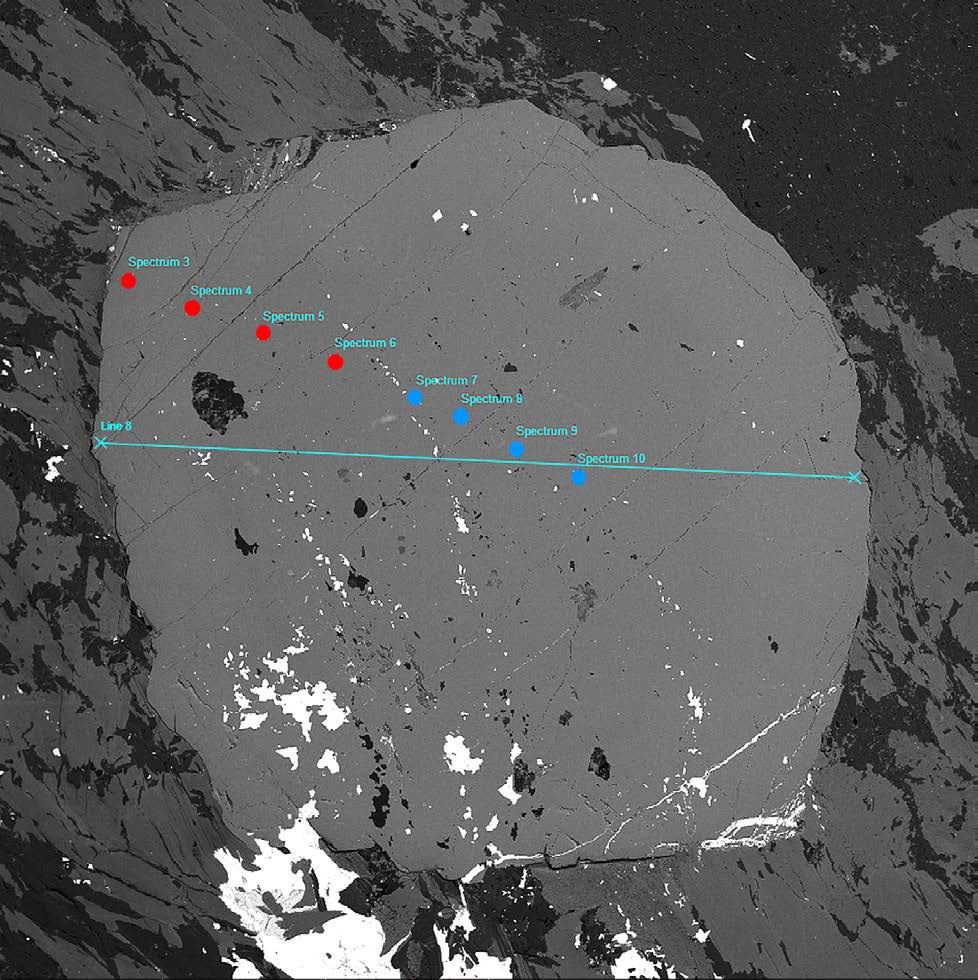
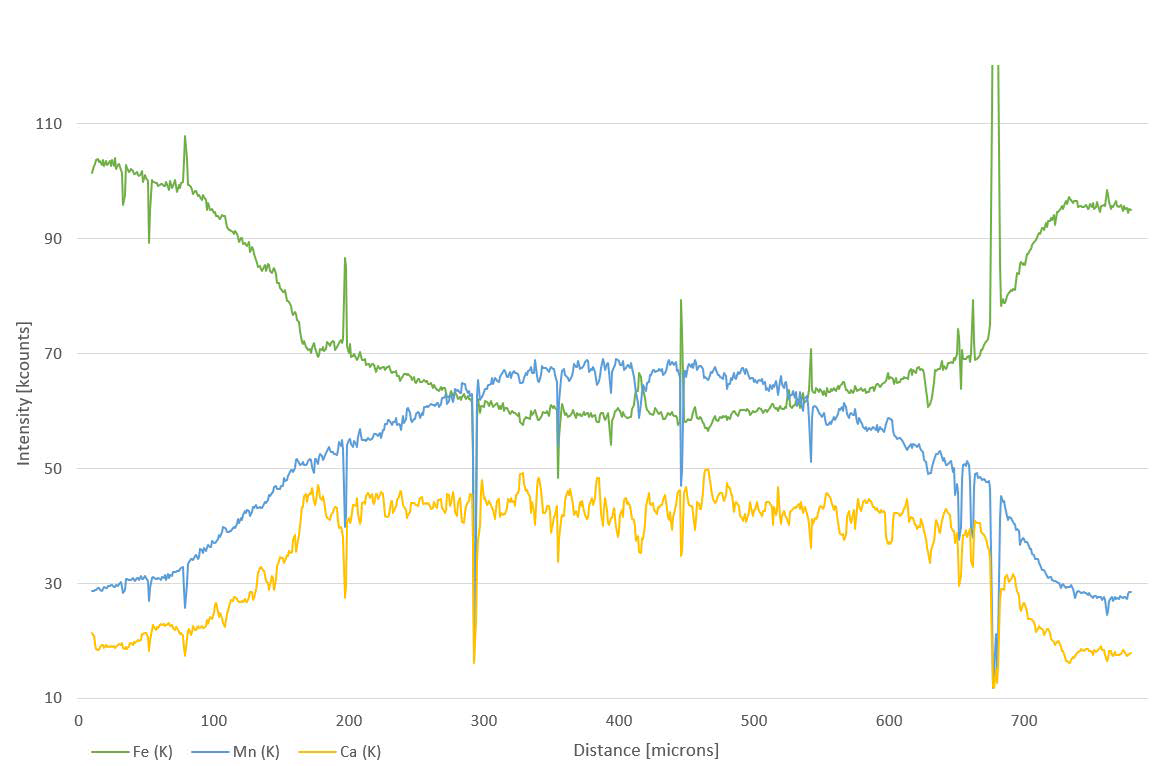
  • Integrated SEM-EDS enables simultaneous imaging and composition mapping

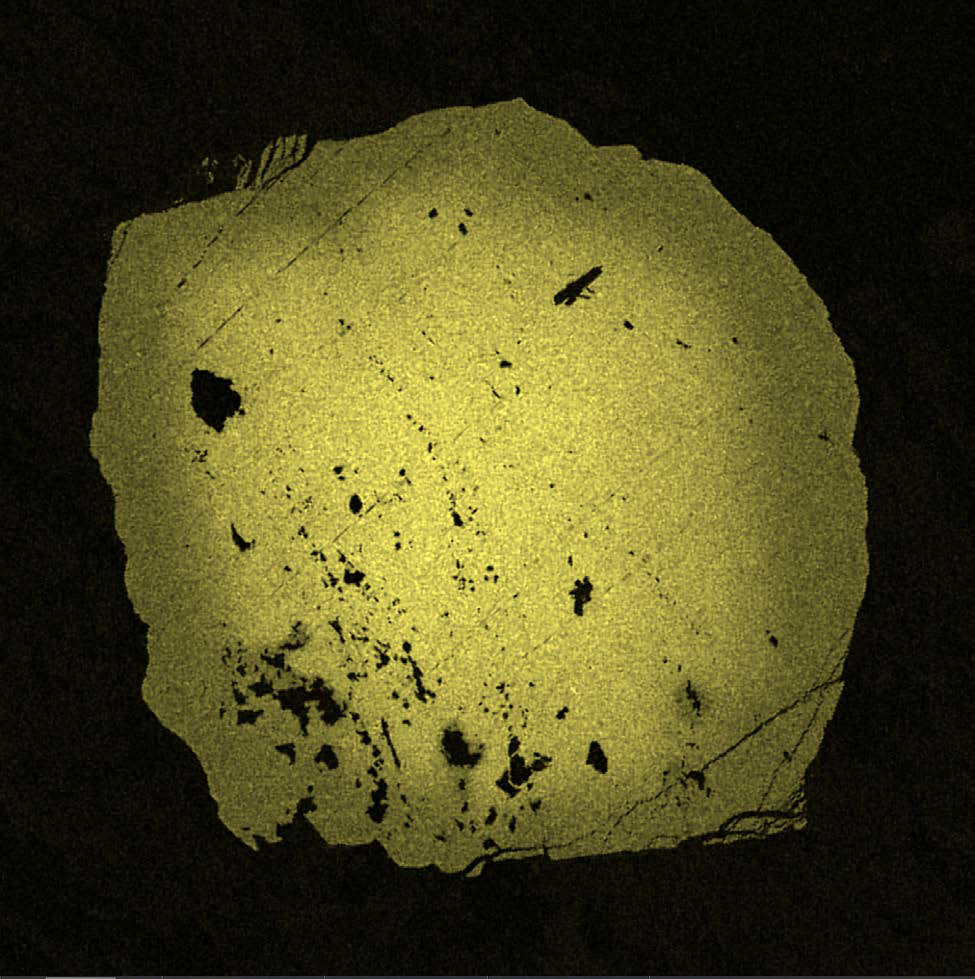
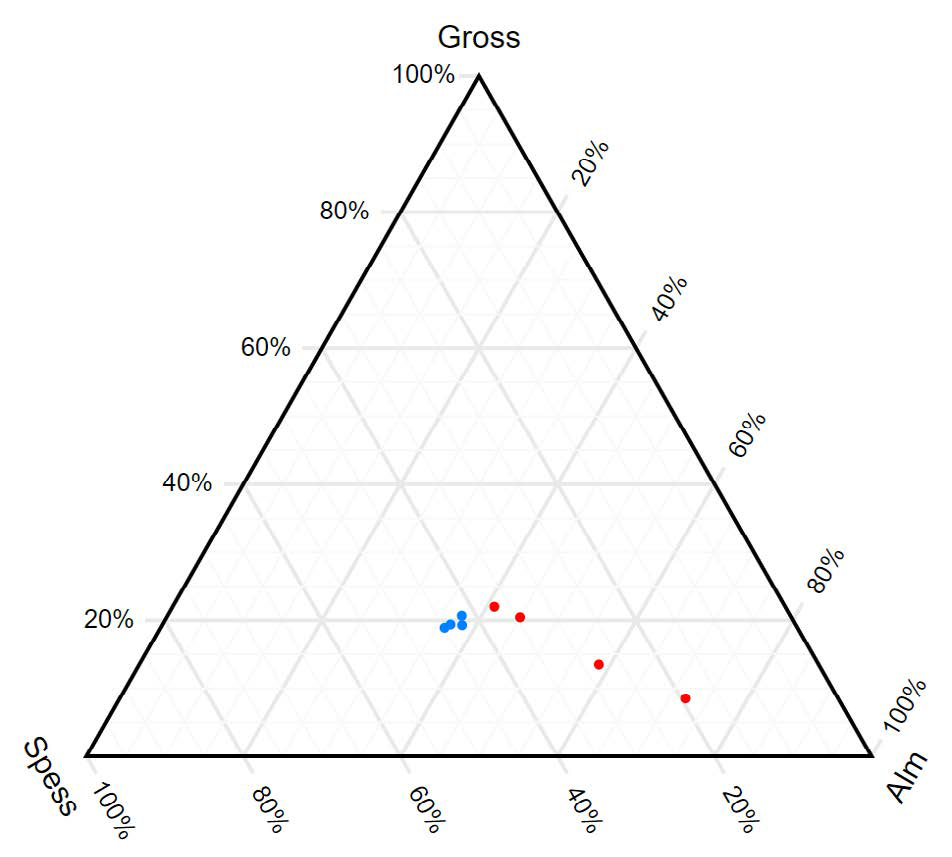
  • Elemental maps expose phase boundaries missed by BSE contrast

  • Dual EDS system accelerates multi-element data collection

  • Wide Field Optics™ supports navigation across large, heterogeneous samples

  • Novice-friendly GUI ensures accessibility without sacrificing analytical power

MIRA XR GM MONO Metal

GET IN Touch

Contact us

map

Where can you find us:

Tescan Brno
Libušina třída 21
623 00 Brno
Czech Republic

info@Tescan.com