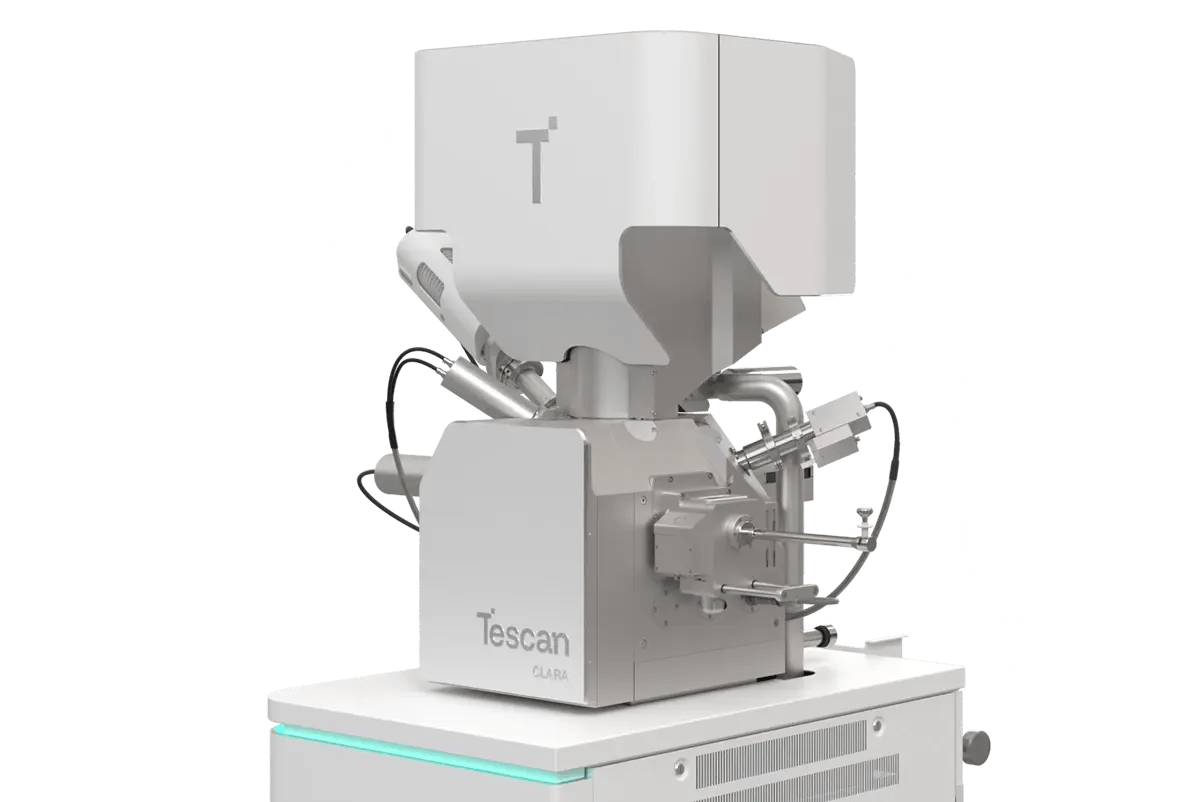
WEBINAR | From Infrastructure to Impact: EM & Micro-CT in Materials Core Facilities

Tracking Grain Refinement After Severe Plastic Deformation

Tescan CLARA with EBSD reveals crystallographic evolution in ECAP-processed aluminum. 

hero
hero
Unlocked content

From Ductile to Strong, and Everything In Between

Grain structure tells the story of how a metal has been worked, shaped, and strengthened. In Equal Channel Angular Pressing (ECAP), aluminum is pushed through a die to introduce extreme shear, producing finer grains and boosting mechanical performance. But to verify what’s happening at the microstructural level, surface imaging alone won’t cut it.

Using a combination of high-resolution SEM, channeling contrast imaging, and EBSD orientation mapping, researchers assessed how repeated ECAP passes altered grain morphology and alignment.

The result? A detailed, spatially accurate view of deformation-driven refinement.

What This Workflow

Makes Possible?

01
Root of the Problem

How Fine Is Fine Enough?

Severe plastic deformation techniques like ECAP are designed to push metals beyond their conventional grain size limits. But once grains shrink into the hundreds-of-nanometers range, conventional metallographic approaches start to fall short.

Without clear visibility into orientation and grain boundary behavior, it becomes difficult to assess whether a process sequence is producing the intended results, or whether it’s time to adjust parameters.

02
Materials and Methods

High-resolution SEM and EBSD mapping are used to assess microstructure after multi-pass deformation

The material under investigation was a commercially pure aluminum alloy processed through eight ECAP passes, introducing a high level of cumulative strain.

The following imaging sequence was conducted using a Tescan CLARA UHR SEM:

  1. SE and BSE imaging with wide-angle signal capture to obtain both channeling contrast and topographic information

EBSD mapping performed on two regions:

  1. 150 × 100 µm for texture overview

  2. 40 × 25 µm for high-detail inspection

BrightBeam™ electron optics delivered field free UHR characterization, while In-Flight Beam Tracing™ ensured seamless and fast application of optimal beam imaging and analytical conditions. Spot Optimization was used to enable detailed mapping of large areas, even at high beam currents. 

03
Results and Discussion

Evidence of Microstructural Progress

The SEM images capturing channeling contrast revealed different crystal orientations for individual grains after ECAP processing. This helped with identifying regions of interest for subsequent EBSD analysis.

The EBSD maps confirmed significant grain refinement, with features reduced to the submicron scale. Orientation data revealed preferential alignment of grains in specific directions, consistent with ECAP-induced shear patterns. The results were suitable for pole figure analysis, giving further insight into the deformation texture.

Altogether, these methods provide both visual and quantitative confirmation that ECAP processing achieved its structural goal: creating a fine-grained, texture-controlled aluminum alloy.

GET IN Touch

Contact us

Get the most out of Tescan

This is more than information; it's an advantage. We've compiled our technical whitepapers, detailed product flyers, and on-demand webinars to provide you with the knowledge that makes a real difference. Sign up now to access the insights you need to make an impact.

Tescan Instruments & Technology

Used in This Workflow

Tescan CLARA

Versatile UHR field emission SEM tailored for high-detail imaging and crystallographic workflows.

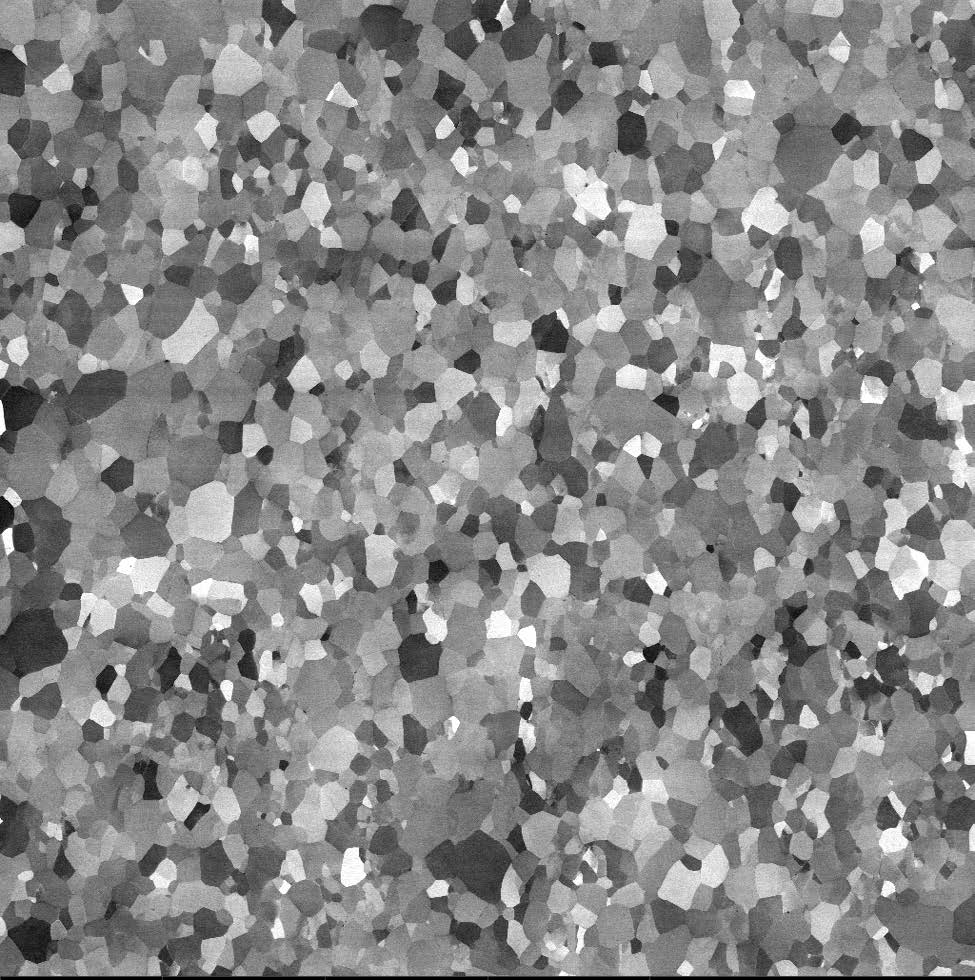
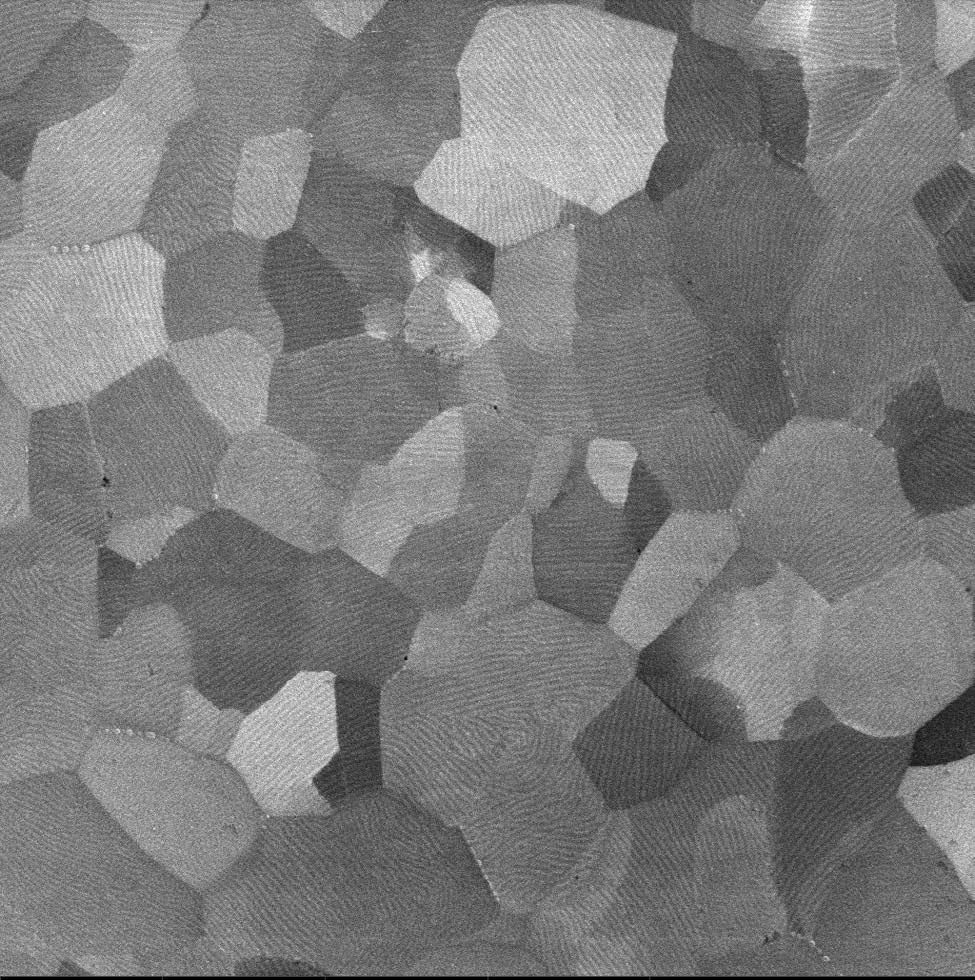
  • In-chamber BSE detection for channeling contrast

  • BrightBeam™ technology for high resolution field free analysis

  • WideField OpticsTM for fast, high resolution EBSD mapping

  • Scintilator BSE detector for efficient channeling contrast detection

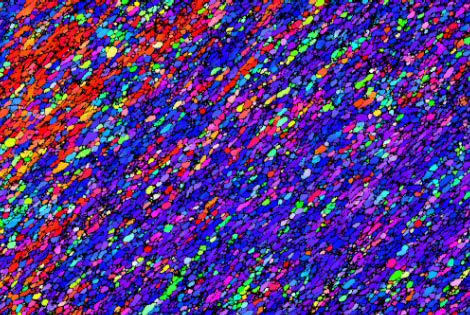
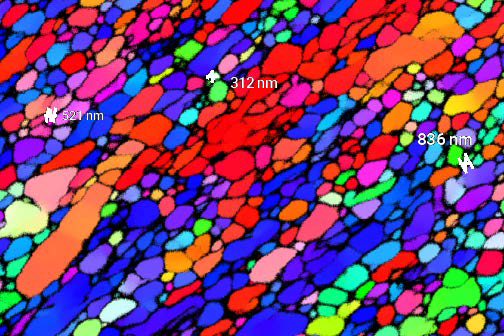
EBSD Mapping: Accelerate Crystallographic Structure Determination

  • Fast, high resolution EBSD data acquisition from large areas

  • Delivers statistically relevant grain orientation data

  • Delivers accurate orientation and boundary maps

  • Ideal for evaluating deformation patterns and process outcomes

CLARA GM Mat. Science

GET IN Touch

Contact us

map

Where can you find us:

Tescan Brno
Libušina třída 21
623 00 Brno
Czech Republic

info@Tescan.com 

130405923 us US 37.09024 -95.712891 25.3575 29.349345 20.67957527 42.082797 39.91384763 -33.693421 13.93320106 3.039986586 31.997988 38.050985 47.579533 48.1485965 58.375799 54.663142 19.195447 56.975106 50.493053 45.868592 10.79556993 44.35660598 43.2371604 55.536415 14.557577179752773 32.100937 -6.116829 -6.212299277967318 23.7104 -33.471062 31.998740087 -23.69149395 43.462349 51.529848 49.1893523 49.197486 25.072375 31.075811 1.299027 40.676979 52.30150662 51.013813 35.684121 37.479653 52.246622 40.581349 39.911632 -26.1811371 41.818215 33.429928

No distributors found.