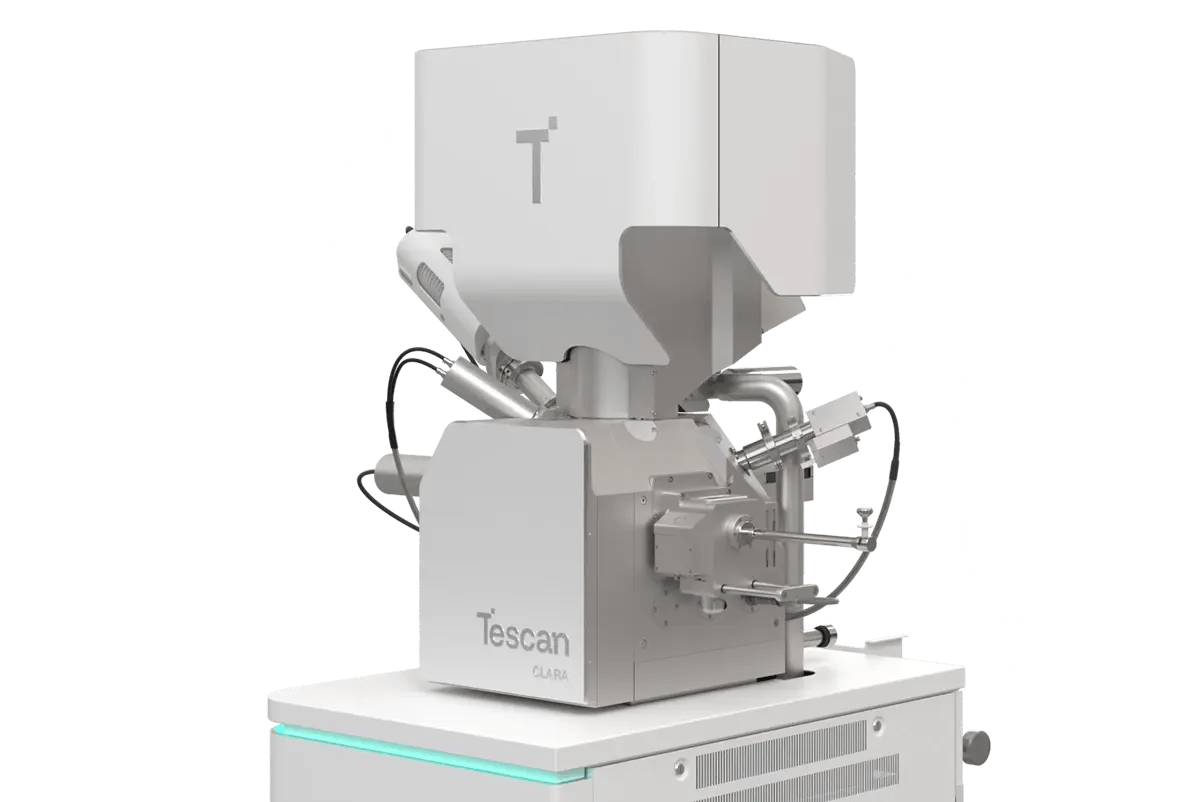
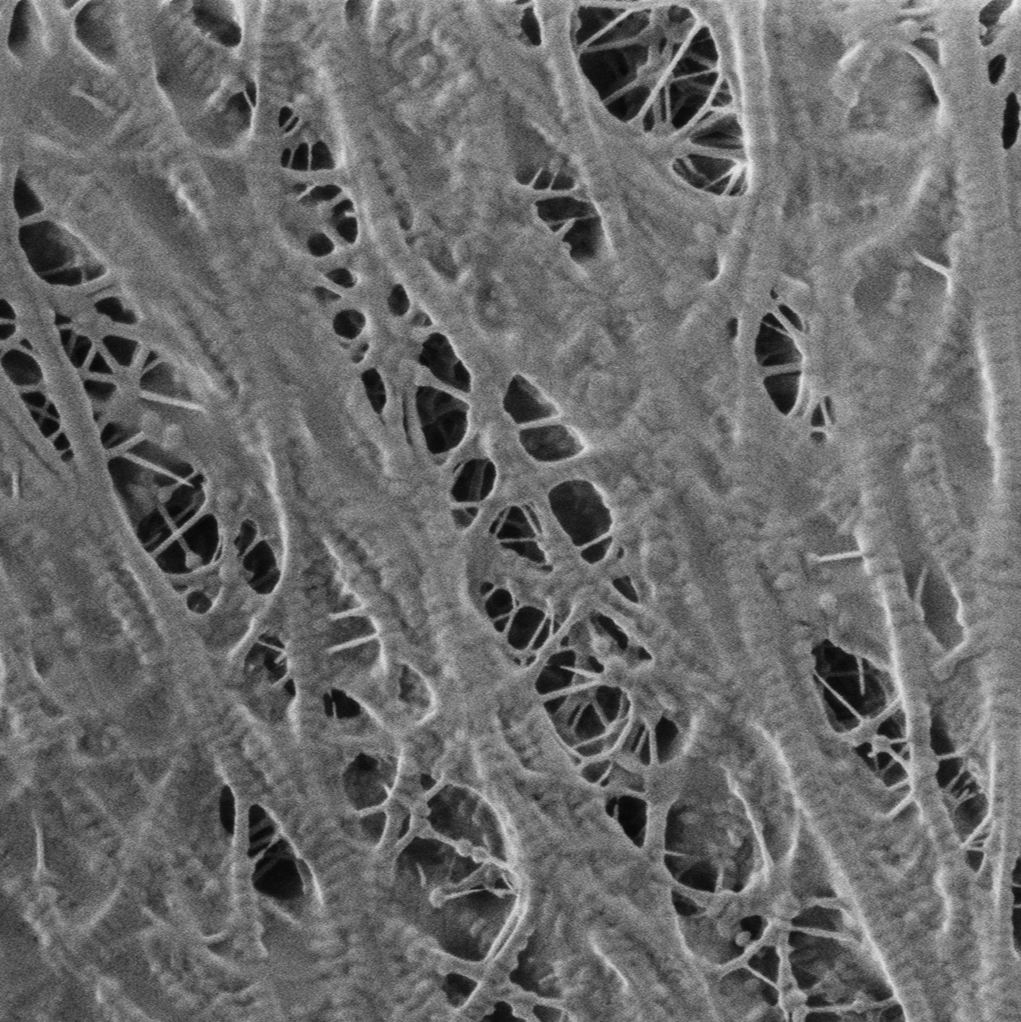
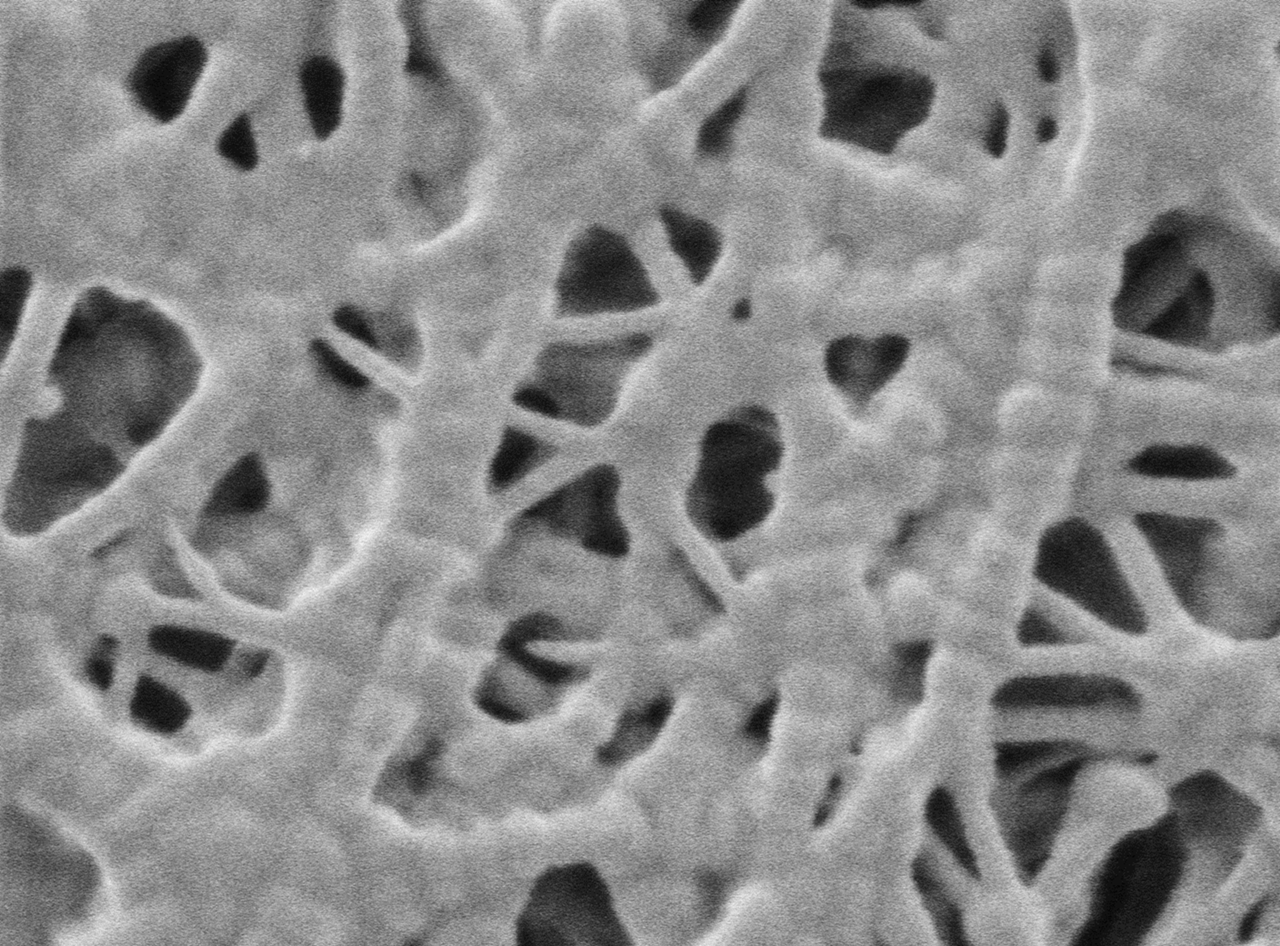
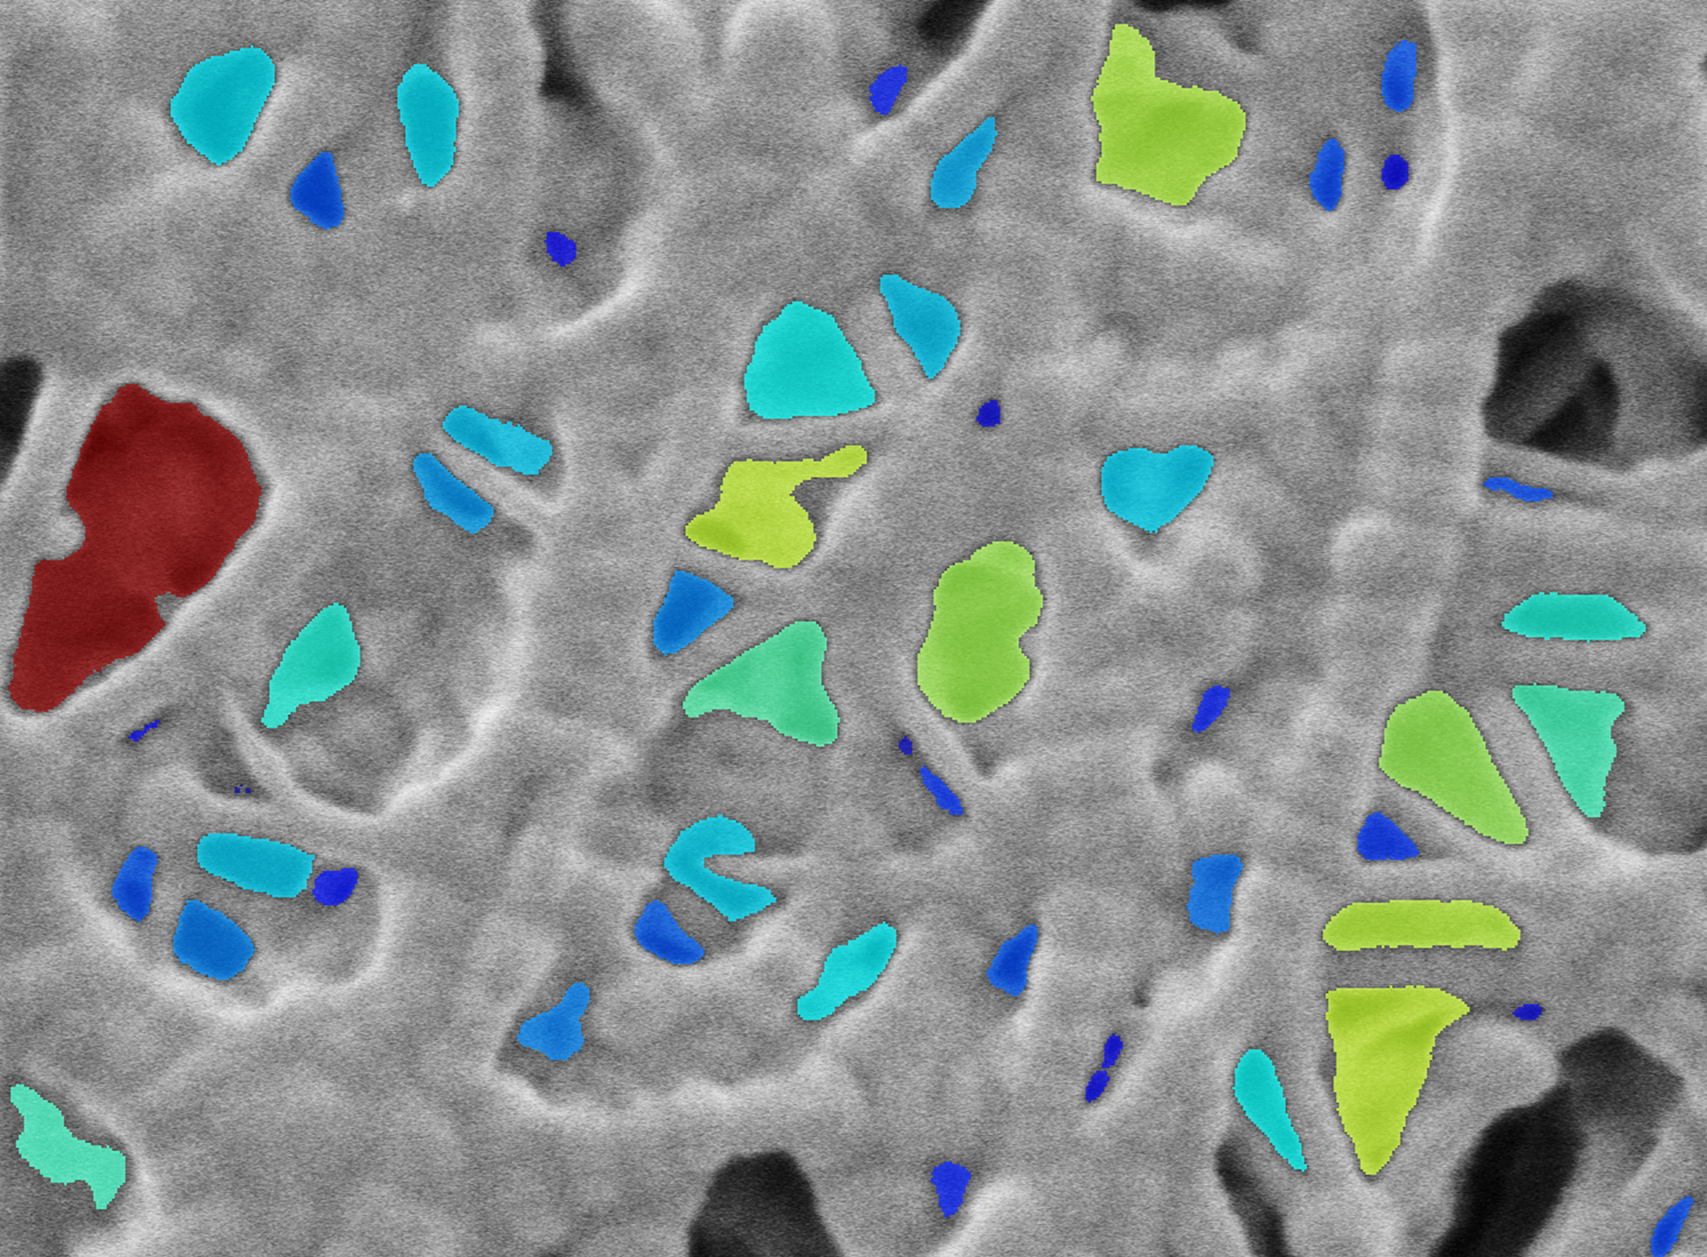
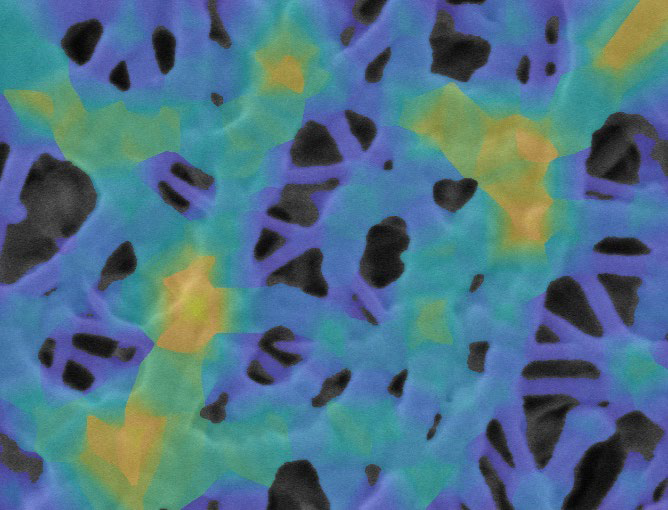
WEBINAR | Up to 40% Faster Automated TEM Lamella Preparation with new Ga⁺ FIB Column

Quantifying Pore Structure in Battery Separators with UHR SEM Imaging

Tescan CLARA delivers non-destructive, nanometer-scale insights into separator porosity — enhancing safety and quality control in lithium-ion battery production.

hero
hero
Unlocked content

Exploring Separator Morphology to Prevent Thermal Runaway

As lithium-ion batteries become thinner, lighter, and more energy-dense, safety margins shrink — and separators carry more responsibility than ever. These porous polymer membranes regulate ion flow while physically isolating electrodes. But if pores are inconsistent or layers too thin, the likelihood of thermal instability and electrical failure increases.

In this study, a polypropylene (PP) separator was examined using Tescan CLARA UHR SEM at low voltage and current — without metal coating — to preserve material integrity. Porosity and fiber thickness were measured via image analysis (MIPAR), providing critical quality metrics for safety-focused battery design. 

Why Study Battery Separator Porosity

with Tescan

01
Root of the Problem

What Makes Battery Separators So Critical?

Though rarely discussed, the battery separator is one of the most safety-critical components in any lithium-ion battery cell. Acting as a physical barrier between the cathode and anode, its porous structure must remain stable under mechanical stress, elevated temperatures, and electrochemical cycling.

Too porous, and it weakens structurally. Too dense, and it restricts ionic flow. Striking this balance is key to avoiding internal short circuits and thermal runaway — especially as cells become thinner and energy density increases.

02
Materials and Methods

UHR SEM for Beam-Sensitive Polymer Imaging

A commercial polypropylene (PP) separator was analyzed using Tescan CLARA at just 200 eV, with no metal coating. The sample’s topography was captured with high clarity using axial detection. Following image acquisition, pore structure and fiber thickness were analyzed using MIPAR image analysis software.

This approach enabled segmentation-based quantification across a representative field of view — yielding detailed statistics while preserving true morphology.

03
Results and Discussion

Measuring Pores, Fibers, and Structural Variability

SEM imaging clearly revealed the open-pore structure of the PP separator. Pore sizes ranged from 20 to 140 nm, with an average of 59 nm, and fiber thickness spanned 20 to 211 nm, averaging 71 nm. These wide distributions indicate significant structural variability — a key consideration for separator reliability.

Variance in porosity can affect both electrochemical efficiency and mechanical integrity, especially in ultra-thin designs. These measurements can be used to inform quality control criteria or guide process optimization for safer battery production.

GET IN Touch

Contact us

Get the most out of Tescan

This is more than information; it's an advantage. We've compiled our technical whitepapers, detailed product flyers, and on-demand webinars to provide you with the knowledge that makes a real difference. Sign up now to access the insights you need to make an impact.

Tescan Instruments & Technology

Used in This Workflow

Tescan CLARA

Tescan CLARA provides high-resolution imaging without magnetic interference, making it ideal for sensitive battery materials. Its automated workflows and contrast flexibility allow precise analysis of powder morphology, particle distribution, and surface texture.

CLARA GM Mat. Science

GET IN Touch

Contact us

map

Where can you find us:

Tescan Brno
Libušina třída 21
623 00 Brno
Czech Republic

info@Tescan.com